Do Phosphorous Soil Tests Alone Predict Yield Responses from Fertilizer?

Tryston Beyrer
Former Research Assistant
Now with the Mosaic Co.
tryston.beyrer@mosaicco.com

Fred Below
Professor of Plant Physiology
Department of Crop Sciences
fbelow@illinois.edu
Introduction
Soil testing for phosphorus (P) is a common practice to estimate the availability of P for a crop and to help predict the probability of a yield response. Predicting the availability of nutrients for a crop is more complicated than just a soil test number, due to variations in the weather, soil type, crop, nutrient source, and agronomic management practices. Since the 1920’s, soil testing has been used to predict the level of nutrients available to the crop. In Illinois, the P soil test recommendation has negligibly changed since published in the 1960’s, while crop production practices, yields, and P uptake have changed substantially. Our goal was to determine whether current soil test recommendations are good predictors of yield responses in modern corn and soybean production systems.
Twenty-one corn and 30 soybean trials were conducted across Illinois over five years to determine the yield response from a premium phosphate fertilizer, MicroEssentials SZ (12-40-0-10S-1Zn). Soil samples were obtained from a depth of 0 to 6 inches prior to planting at each site and analyzed using the Mehlich III extraction method. Using 4R nutrient stewardship (right source, rate, time, and place), fertilizer application rates were estimated based on the nutritional needs for high yielding crops. In a separate pass prior to planting, banded MicroEssentials SZ was placed at approximately 4 inches beneath the future planted crop row. Fertilization and planting operations used RTK sub-inch accuracy guidance to apply rates of 100 and 75 lbs P2O5 per acre for corn and soybean respectively, and fertilized plots were compared to plots receiving no P fertilizer. Multiple commercial corn hybrids and soybean varieties were used in each trial and all plots received standard management practices commonly implemented for Illinois corn and soybean production, including conventional weed and pest management, tillage, and for corn, approximately 160-180 lbs per acre of nitrogen. Corn was grown in 30 inch rows while soybean results were averaged across 30- and 20-inch rows to emulate a range of row spacings used for soybean. From these trials we learned:
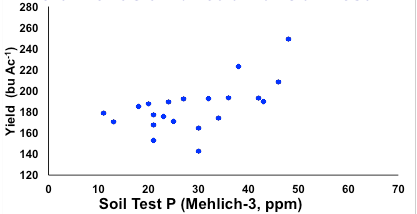
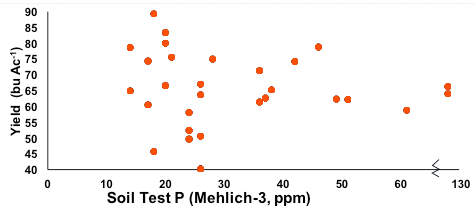
Are soil test P levels a good predictor of final grain yields?
Soil test P values were not a good predictor of yield in the plots receiving no P fertilizer for either crop (Figure 1). Other factors, such as the environment and/or hybrid/variety may have contributed to greater utilization of the available P for yield. Since it is currently not possible to accurately predict future weather and therefore potential yield, a fertility program should be managed for success at the beginning of the season to minimize possible plant nutrient deficiency and reduced yield.
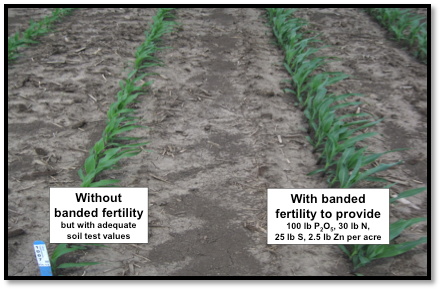
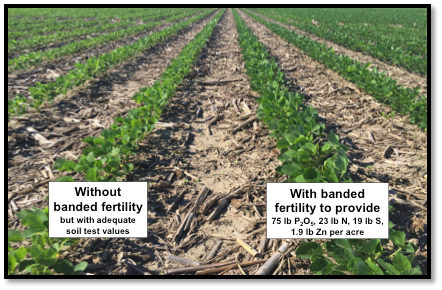
Can additional P increase yield when soil test P levels are currently labeled sufficient?
The current Illinois critical level for P is 20 ppm, indicating that crops grown in soils with P levels greater than this threshold likely would not increase yield with added P. Combining several of the best 4R management practices into a comprehensive fertility program has led to very consistent early season visual crop growth responses across a range of soil test P levels and locations tested between 2011 and 2015 (Figure 2).
Most of the corn sites (81%) exhibited soil test P levels above the Illinois critical P soil test level, yet banded MicroEssentials SZ increased yield by an average of 5.5% at these sites (Figure 3). Soybean yield responses from fertilizer applications at sites where the soil test P level exceeded the 20 ppm critical level were similar to that of corn, with yields increasing an average of 5.6% (Figure 3).
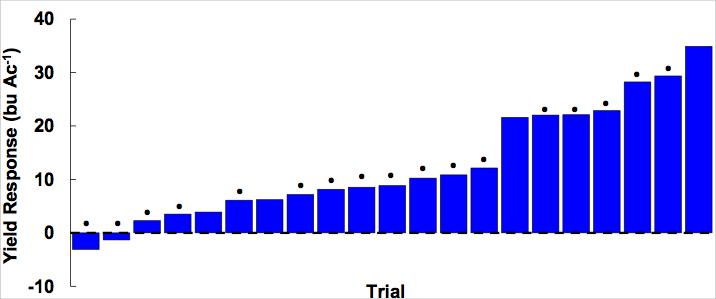
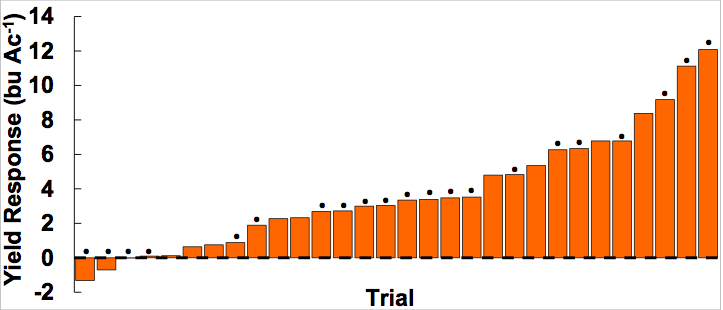
Irrespective of the soil test level, banded P applications increased corn yield by an average of 11.5 bushels per acre (6.1%) and 3.8 bushels (5.6%) for soybean. Neither corn nor soybean yield responses from banded MicroEssentials could be adequately predicted using the current P soil test recommendations, although yield increases did tend to be greater as soil test P level dropped below 40 ppm (Figure 4 & Table 1).
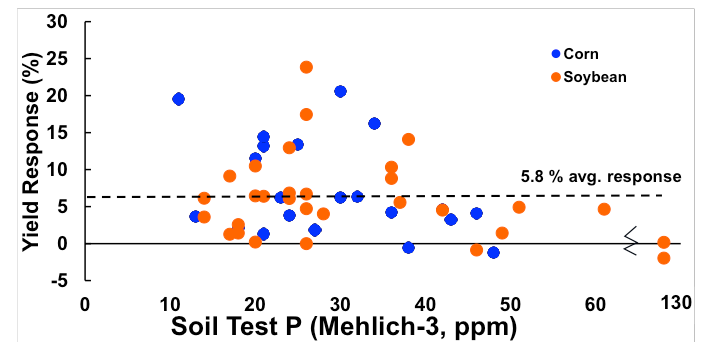
Table 1. Percentage yield increases for corn and soybean from banded MicroEssentials SZ for different ranges of soil test P values. The numbers of sites in each respective soil test category are shown in parenthesis (n).
| Crop | ||
|---|---|---|
| Soil Test P (ppm) | Corn | Soybean |
| Yield Increase, % | ||
| ≤ 20 | 9.1 (4) | 5.4 (9) |
| >20-40 | 6.9 (13) | 8.7 (14) |
| >40 | 2.5 (4) | 2.2 (7) |
How should soil tests be used for phosphorus management decisions?
Increasing environmental concerns necessitate alternative technologies for applying crop nutrients in order to decrease nutrient loss and promote increased nutrient recovery across all soil test levels. Employing multiple 4R nutrient stewardship practices, such as spring-banded MicroEssentials SZ in this particular study, resulted in significant increases in corn and soybean grain yield. Yield increases from added P generally were greater with lower soil test P levels; however, yield increases as large as 15% occurred at soil test levels up to nearly 40 ppm P. These data confirm the importance of soil testing as a valuable starting point for phosphorus management, although other agronomic factors may need to be considered for greater confidence in estimating crop response to P. These new findings suggest that greater yields may be possible from added P on soils testing above the current critical levels; however it is paramount that any nutrient applications are coupled with the best 4R nutrient stewardship and agronomic management principles.
printable .pdf of this page